
Panel Capacity Platform
Live dashboard, updated monthly with your data to track panel growth, plan capacity and manage new patient targets.
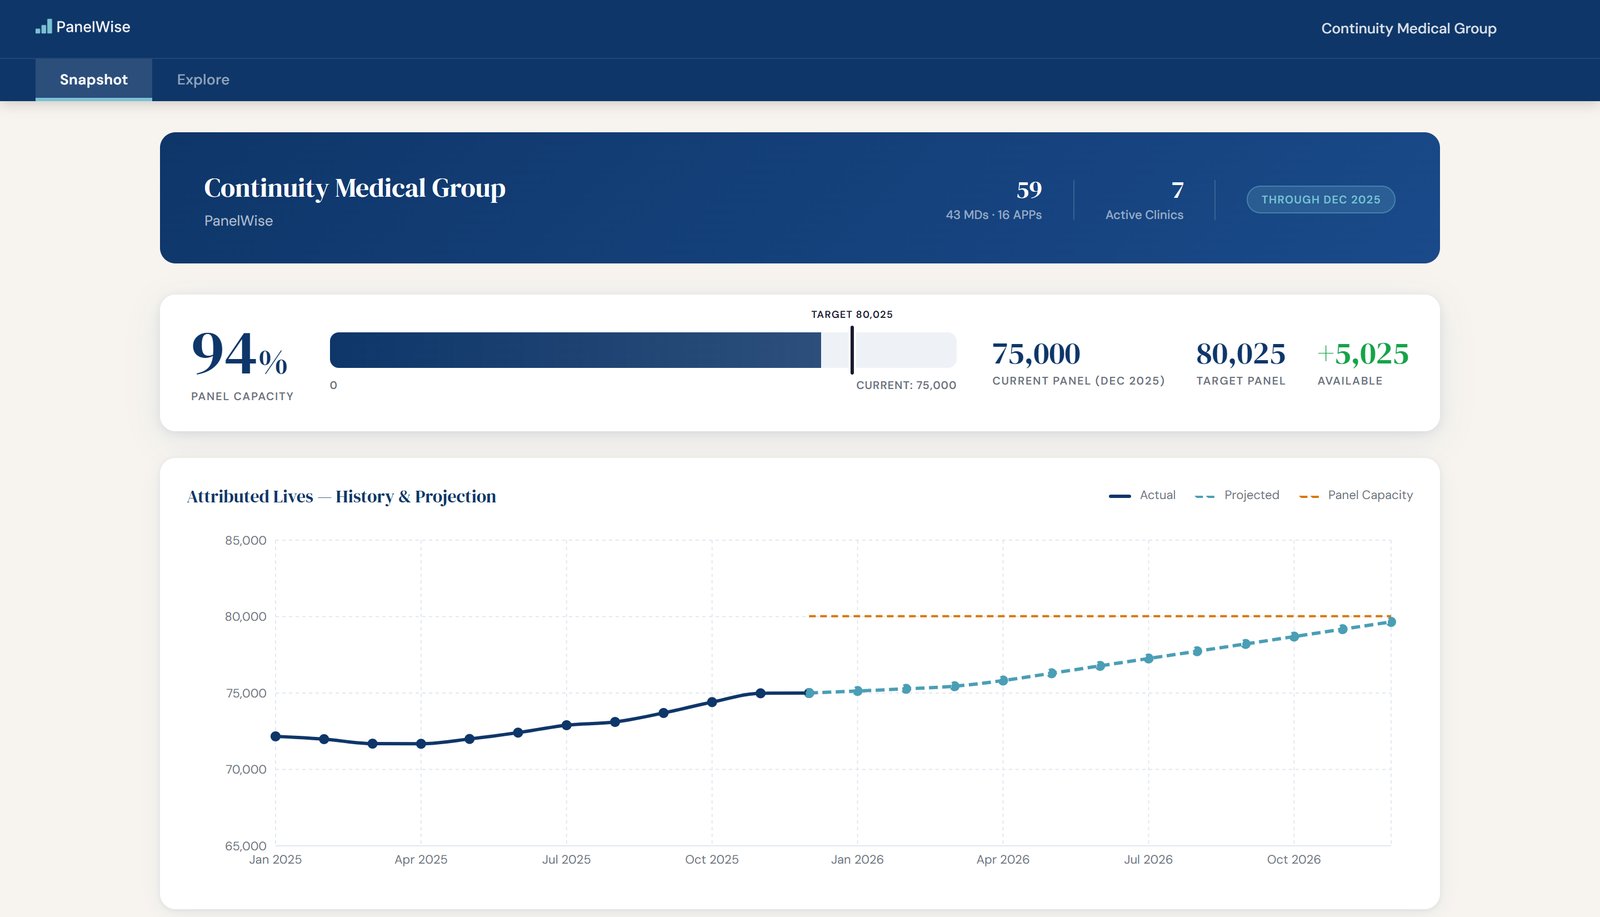
Group overview. Shown with demonstration data.
- Monthly refreshNew visit and appointment data every month. No spreadsheets to rebuild.
- Provider targetsWeekly new patient targets for each provider, with booked and kept visits tracked against them.
- PlansPanel plans for each provider and clinic, with progress against the year.
- Access trackingNew patient wait, cancellations and same-day access as they change.
New patient targets for every provider
Kept new patient appointments by provider and month, built to be confirmed with each clinic and worked from.
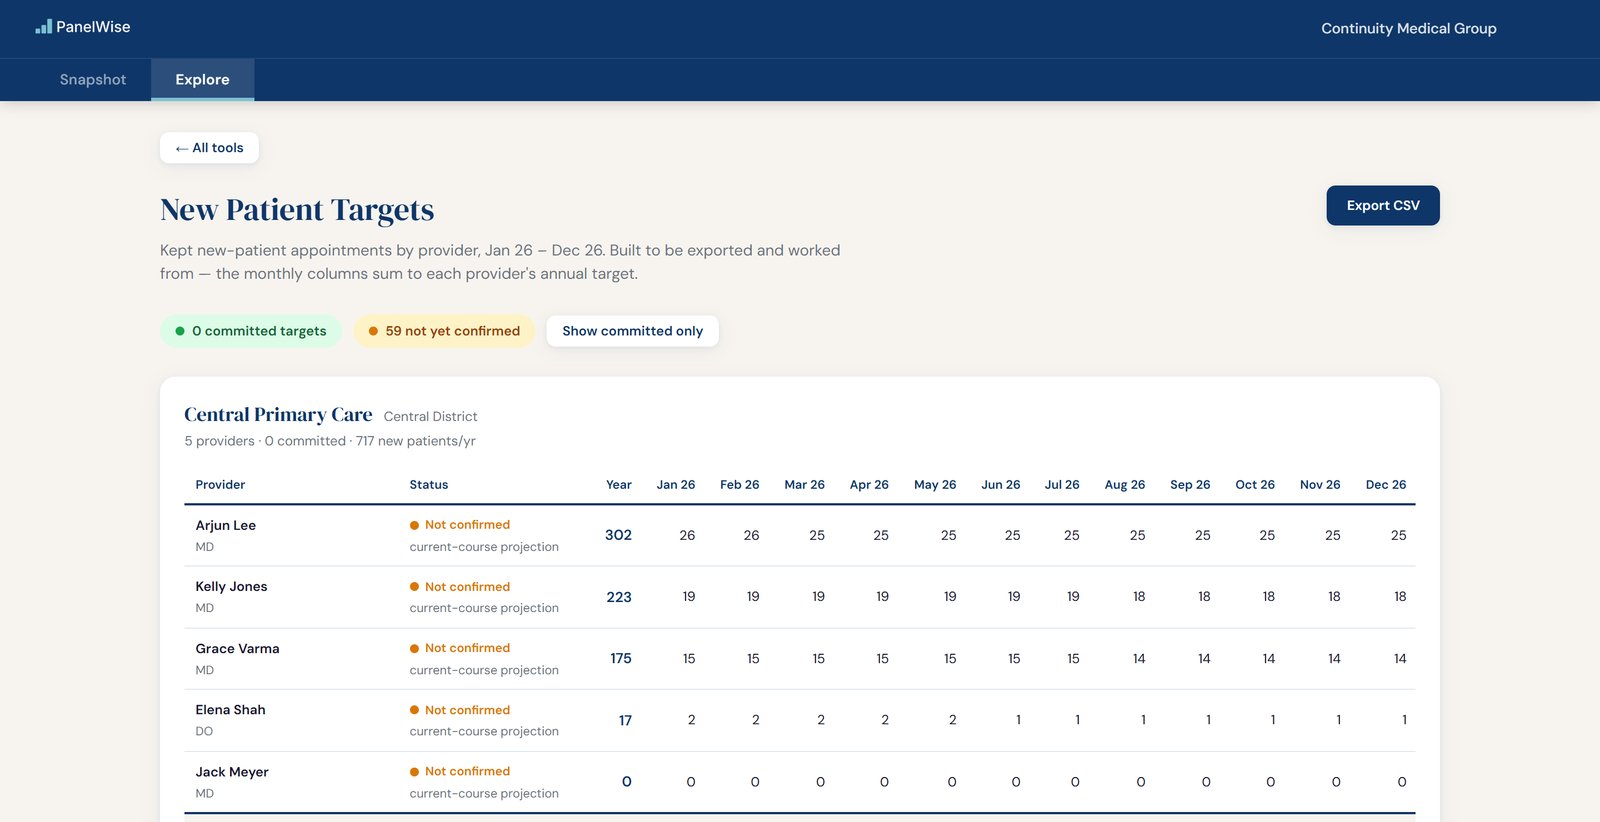
Shown with demonstration data.
A plan for every provider
Each provider’s plan for the year: visits, new patients and the panel they lead to, with what is modeled from your data.
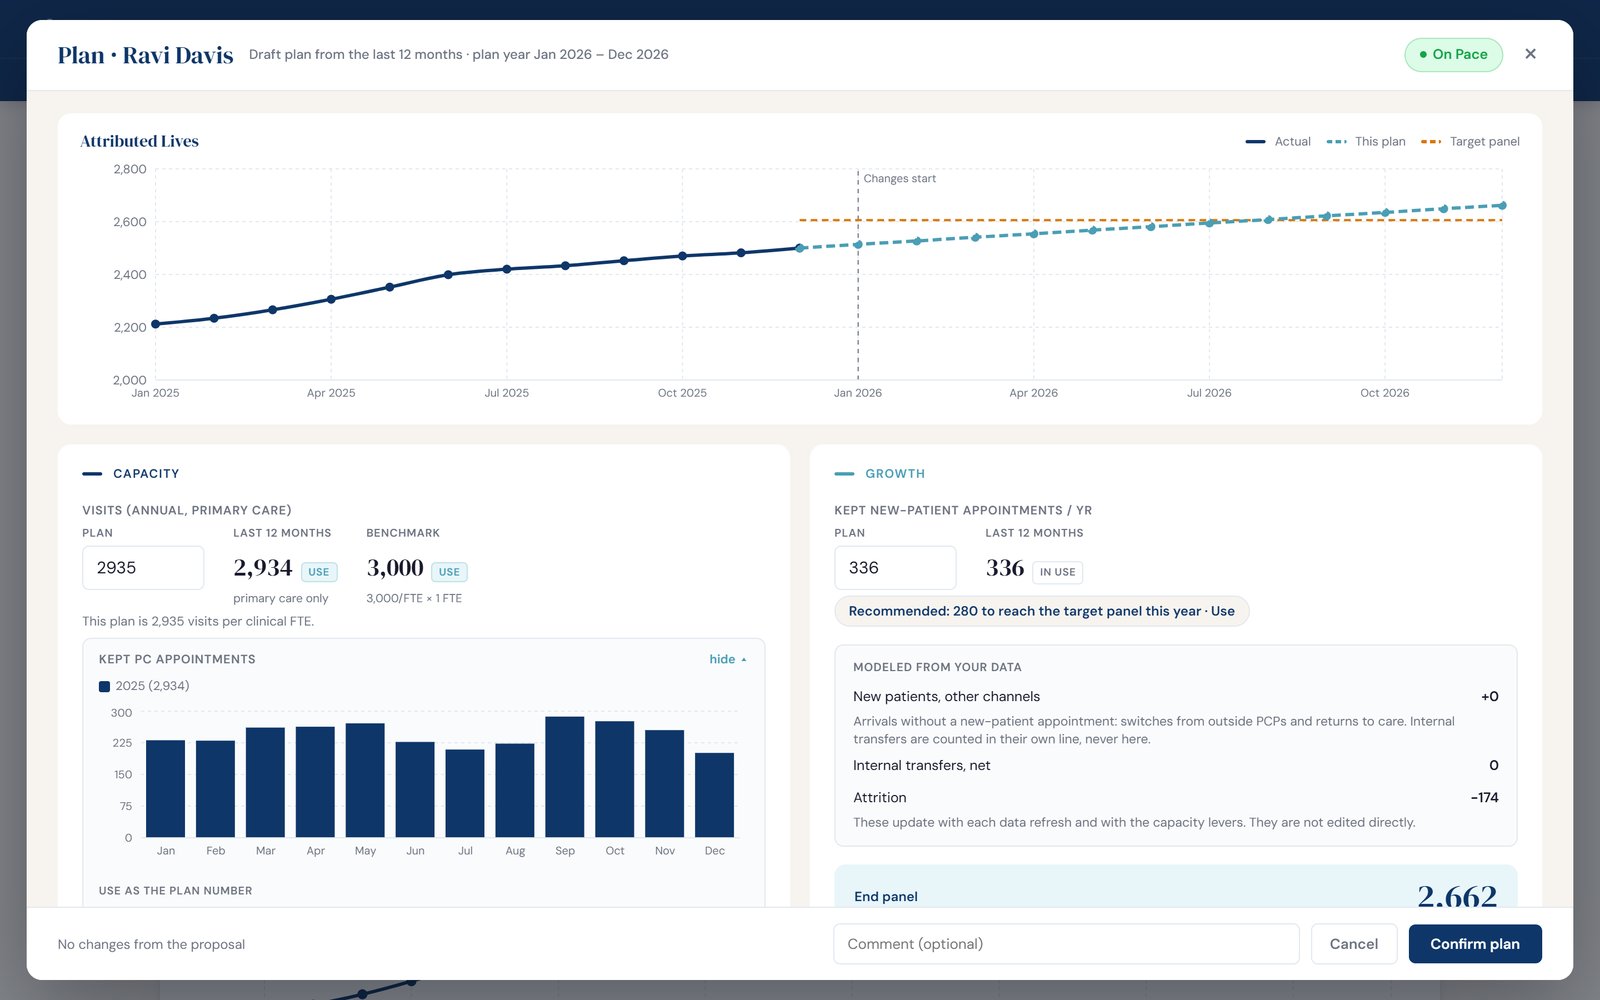
Shown with demonstration data.
Capacity and access, provider by provider
Visits, productivity, visit frequency and care team support, alongside who the panel serves, continuity, same-day access and days to a new patient appointment.
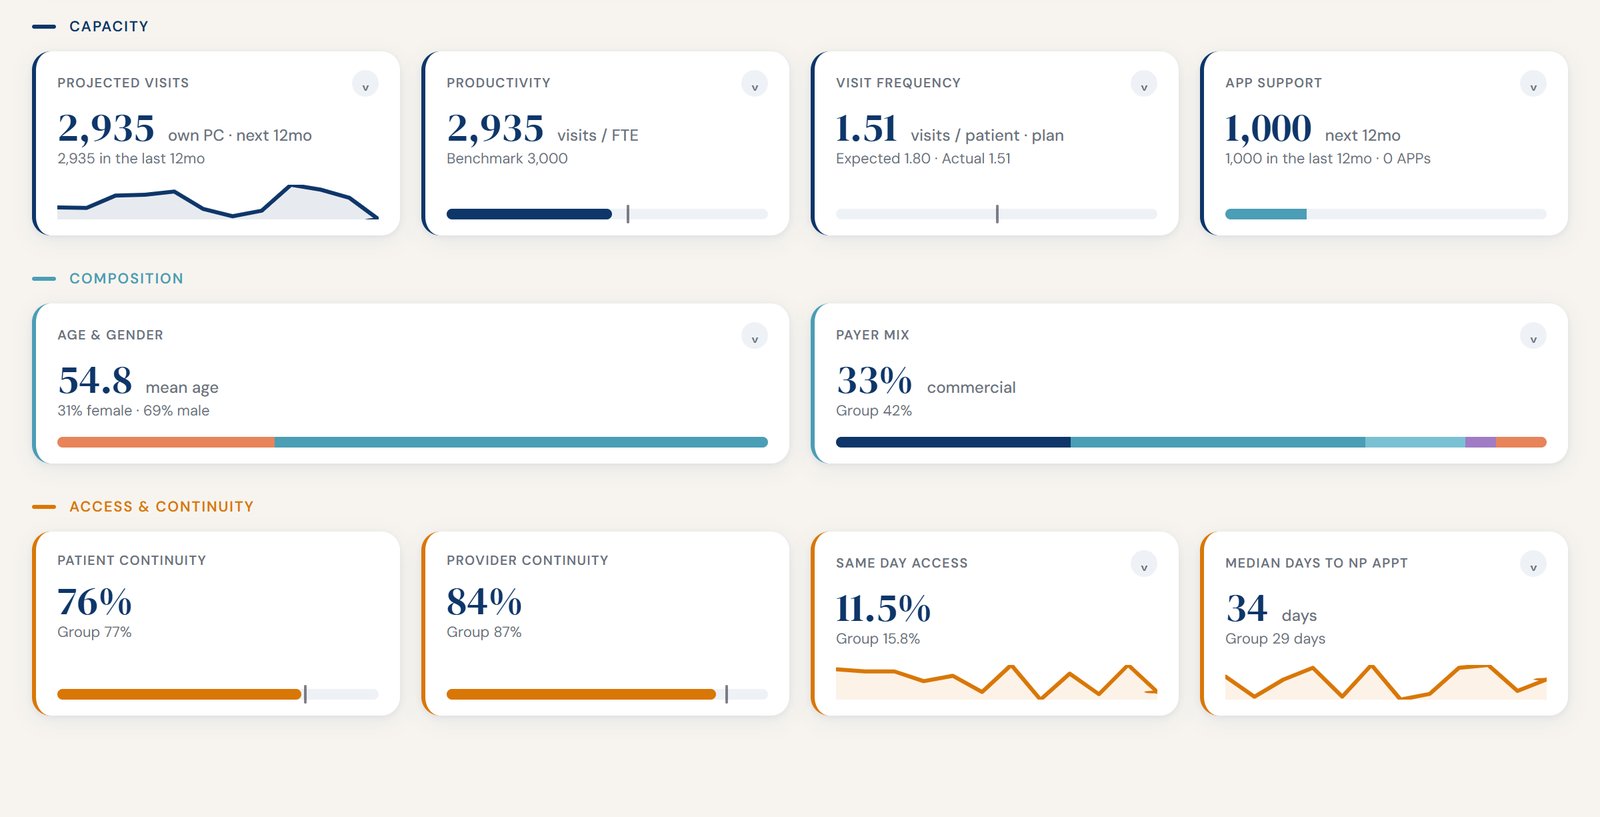
Shown with demonstration data.
New patients and panel flows
Kept and booked new patient appointments by month, with the projection, and where additions and departures come from.
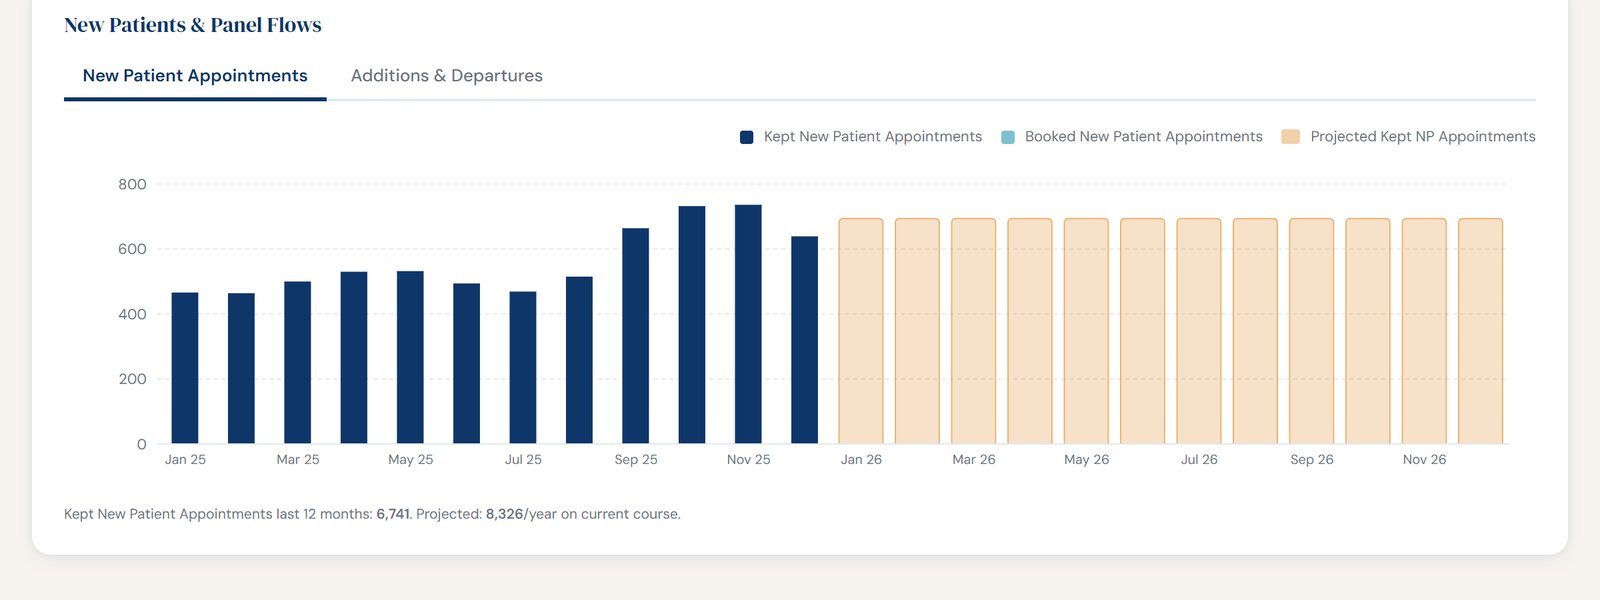
Shown with demonstration data.
It starts with the Diagnostic
Every number in the Diagnostic stays live, by clinic and by provider, after the report is delivered.